背景:有同学和我反馈,春节前后历史分析文章不错, 是否可以分析下历年1月份的表现。大家都知道历年1月份表现较差,到底有多差,没有直观感受。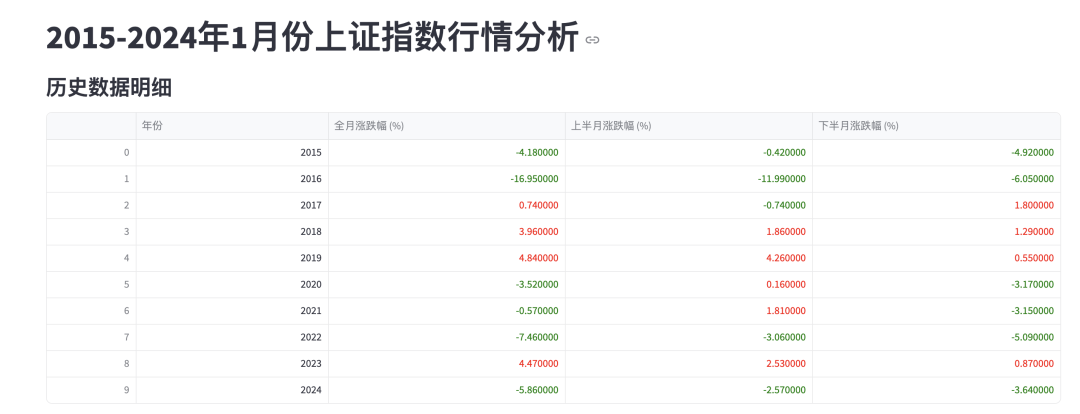
import streamlit as st
import akshare as ak
import pandas as pd
import matplotlib.pyplot as plt
from datetime import datetime
# 解决中文乱码问题
plt.rcParams['font.sans-serif'] = ['STHeiti'] # 苹果系统字体
#plt.rcParams['font.sans-serif'] = ['SimHei'] # 使用黑体
plt.rcParams['axes.unicode_minus'] = False # 解决负号显示问题
# 设置页面标题
st.set_page_config(page_title="上证指数1月行情分析", layout="wide")
st.title("2015-2024年1月份上证指数行情分析")
# 获取数据
@st.cache_data
def get_shanghai_index(year):
try:
df = ak.stock_zh_index_daily(symbol="sh000001")
df['date'] = pd.to_datetime(df['date'])
df_year = df[(df['date'].dt.year == year) & (df['date'].dt.month == 1)]
return df_year.sort_values('date')
except Exception as e:
st.error(f"获取{year}年数据时出错: {str(e)}")
return pd.DataFrame()
# 初始化结果表
results = []
# 分析数据(保持原有逻辑不变)
for year in range(2015, 2025):
df = get_shanghai_index(year)
if not df.empty:
# 全月数据
full_month_start = df.iloc[0]['close']
full_month_end = df.iloc[-1]['close']
full_month_change = (full_month_end - full_month_start) / full_month_start * 100
# 上半月(1-15日)
first_half = df[df['date'].dt.day <= 15]
if not first_half.empty:
first_half_start = first_half.iloc[0]['close']
first_half_end = first_half.iloc[-1]['close']
first_half_change = (first_half_end - first_half_start) / first_half_start * 100
else:
first_half_change = None
# 下半月(16日之后)
second_half = df[df['date'].dt.day > 15]
if not second_half.empty:
second_half_start = second_half.iloc[0]['close']
second_half_end = second_half.iloc[-1]['close']
second_half_change = (second_half_end - second_half_start) / second_half_start * 100
else:
second_half_change = None
results.append({
'年份': year,
'全月涨跌幅 (%)': round(full_month_change, 2),
'上半月涨跌幅 (%)': round(first_half_change, 2) if first_half_change else None,
'下半月涨跌幅 (%)': round(second_half_change, 2) if second_half_change else None
})
# 创建DataFrame
results_df = pd.DataFrame(results)
# 显示原始数据(修改颜色逻辑)
st.subheader("历史数据明细")
styled_df = results_df.style.applymap(
lambda x: 'color: red'if isinstance(x, (int, float)) and x > 0 else'color: green',
subset=['全月涨跌幅 (%)', '上半月涨跌幅 (%)', '下半月涨跌幅 (%)']
)
st.dataframe(styled_df, use_container_width=True)
# 显示统计数据(保持原有逻辑不变)
st.subheader("统计分析")
col1, col2, col3 = st.columns(3)
with col1:
st.metric("全月平均涨跌幅", f"{round(results_df['全月涨跌幅 (%)'].mean(), 2)}%")
st.metric("全月上涨概率", f"{round(len(results_df[results_df['全月涨跌幅 (%)'] > 0])/len(results_df)*100, 2)}%")
with col2:
st.metric("上半月平均涨跌幅", f"{round(results_df['上半月涨跌幅 (%)'].mean(), 2)}%")
st.metric("上半月上涨概率", f"{round(len(results_df[results_df['上半月涨跌幅 (%)'] > 0])/len(results_df)*100, 2)}%")
with col3:
st.metric("下半月平均涨跌幅", f"{round(results_df['下半月涨跌幅 (%)'].mean(), 2)}%")
st.metric("下半月上涨概率", f"{round(len(results_df[results_df['下半月涨跌幅 (%)'] > 0])/len(results_df)*100, 2)}%")
# 绘制趋势图(已解决中文乱码)
st.subheader("年度走势可视化")
fig, ax = plt.subplots(figsize=(12, 6))
results_df.set_index('年份').plot(kind='bar', ax=ax)
plt.xticks(rotation=45)
plt.ylabel('涨跌幅 (%)')
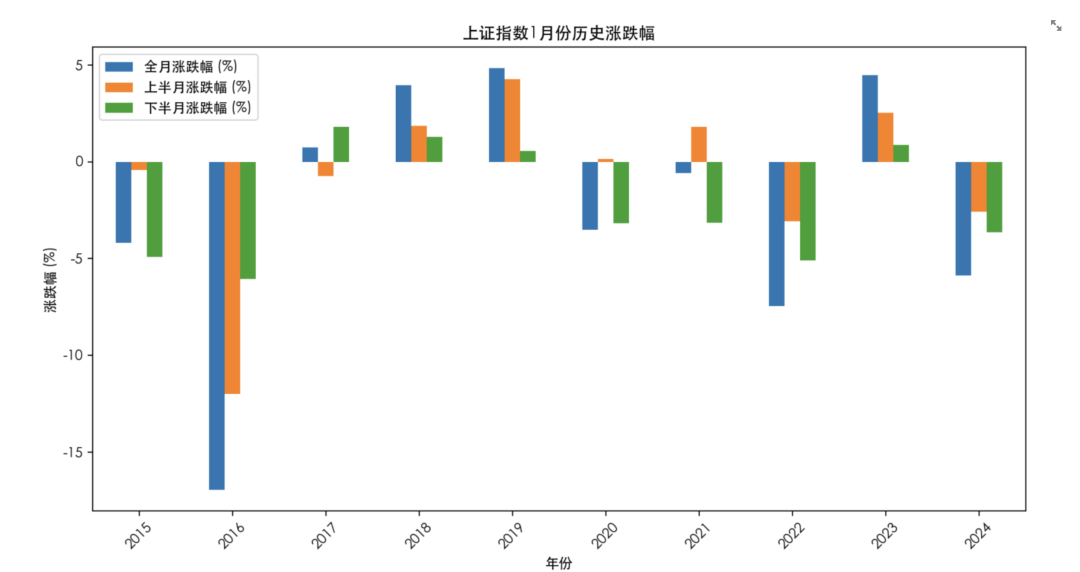
plt.title('上证指数1月份历史涨跌幅')
st.pyplot(fig)
也许有同学会说,今天是2025年1月份最后1个交易日了, 分析这个有什么用。事后诸葛亮么?我想说的是,我习惯用历史数据表现来验证自己的判断, 我也要我自己的大体思想, 来指导我的行动。 之前1月份初的时候,我就说过,在美股没明显止跌前, 我最近可能会很少操作A股了。在1月13号美股没止跌之前,我算是管住了手,天天直接国债逆回购了。虽然相信AI眼镜的逻辑,但考虑到收益风险比,就放弃了,相应的也错过了AI眼镜的大肉。 1月13日晚,美股大涨,之后我开始关注起来,由于关注得比较晚, 人形机器人概念由于恐高,选的股相对保守了点,就吃了千把块的肉沫。虽然我内心更倾向于 五洲新春这种玄学股, 但没有如果 。所幸上周行情表现不错,小赚一笔过年钱。主要是周五行情不错, 接近13cm还是蛮香的, 期望今天和年后继续涨停,看看自己是不是在做梦。 另外,有同学私信我想加群的。这里说明下,前几天建了3个群, 编程交流、 AI交流、 投资交流。 加我微信备注下就可以进群交流。有人可能会疑惑,加群是不是收费的,是不是为了割韭菜,这里声明下, 免费交流。 但群里的观点不一,要有自己的分析判断, 自己长脑子,不要被别人误导了自己,被市场割了韭菜。
最后 祝大家在新的一年暴富、赚大钱。


