Matplotlib是Python中最流行和使用最广泛的数据可视化库之一。它提供了一个类似MATLAB的绘图接口,能够创建各种静态图表。它支持线图、散点图、柱状图、直方图等多种图表,可以兼容其他科学计算库(如 NumPy、Pandas),并且有大量的教程和示例可供参考。但它默认的可视化风格相对单调,交互式功能不足。

本文介绍6个能够美化Matplotlib可视化样式的python库,它们可以为常规的线图/散点图、直方图和其他基本可视化图着色。
我们首先生成一组样例数据,每个python库生成4个可视化子图,这样就可以在同类数据上对它们进行比较。
1import matplotlib
2import matplotlib.pyplot as plt
3import numpy as np
4import pandas as pd
5import seaborn as sns
6
7'''Generating points to create a scatter plot'''
8def scatter():
9 x = np.random.random(100)
10 y = x-np.random.random(100)
11 z = np.random.randint(0,4,100)
12 df = pd.DataFrame({'X':x, 'Y': y, 'Z':z})
13 return df
14
15'''Generating points to create a line plot'''
16def line():
17 x = np.arange(0,10,0.1)
18 y_1 = np.sin(x)
19
y_2 = np.sin(x+5)
20 y_3 = np.sin(x+10)
21 y_4 = np.sin(x+15)
22 y_5 = np.sin(x+20)
23 df = pd.DataFrame({'X':x,'y_1':y_1, 'y_2':y_2,
24 'y_3':y_3, 'y_4':y_4, 'y_5':y_5})
25 return df
26
27'''Sampling data from several distributions'''
28def hist():
29 x_1 = np.random.normal(1,0.1,1000)
30 x_2 = np.random.gamma(1,0.25,1000)
31 x_3 = np.random.normal(0.4, 0.1,1000)
32 x_4 = np.random.normal(-0.1, 0.3,1000)
33 df = pd.DataFrame({'X_1': x_1, 'X_2':x_2, 'X_3': x_3, 'X_4':x_4})
34 return df
Aquarel
Aquarel是一个轻量级模板引擎,也是Matplotlibs的rcparams包装器,可让绘图样式变得简单。Aquarel模板可以通过编程定义,并以JSON格式序列化和共享。该python库提供12种样式模板。
https://github.com/lgienapp/aquarel

使用pip安装Aquarel:
pip install aquarel
通过以下代码使用这些模板:
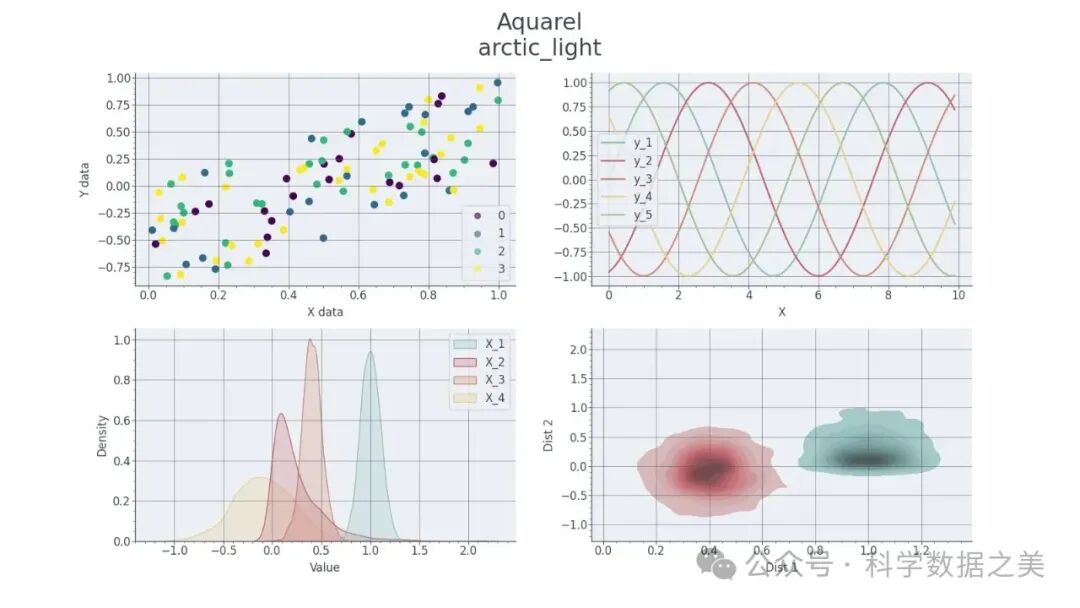
1with load_theme("arctic_light"):
2
3 fig, ax = plt.subplots(ncols=2, nrows=2, figsize=(16,9))
4 df = scatter()
5 f= ax[0,0].scatter(df.X,df.Y, c=df.Z, s=50)
6 ax[0,0].set_xlabel('X data')
7 ax[0,0].set_ylabel('Y data')
8 handles, labels = f.legend_elements(prop="colors", alpha=0.6)
9 legend2 = ax[0,0].legend(handles, labels, loc="lower right")
10
11 df=line()
12 df.plot(x='X', ax=ax[0,1])
13
14 df=hist()
15 sns.kdeplot(df, fill=True, ax=ax[1,0])
16 ax[1,0].set_xlabel('Value')
17
18 sns.kdeplot(df, x="X_1", y="X_2", fill=True, ax=ax
[1,1])
19 sns.kdeplot(df, x="X_3", y="X_4",fill=True, ax=ax[1,1])
20 ax[1,1].set_xlabel('Dist 1')
21 ax[1,1].set_ylabel('Dist 2')
22
23 plt.suptitle('Aquarel\narctic_light', fontsize=24)
24 plt.savefig('arctic_light.jpg')
25 plt.show()
可视化效果如下图:

rose-pine-matplotlib
它不是一个库,而是一组主题样式,用户需要下载这些主题,放到mpl_configdir/stylelib目录内,然后在代码中指定该模板的路径,例如:
1plt.style.use('rose-pine')
之后,你只需执行相同的绘图步骤即可。这个库的色调比较柔和,同时对比度也足够大。
https://github.com/h4pZ/rose-pine-matplotlib

Catppuccin
它包括4种不同的可视化风格,具有不同的暗色程度。
https://github.com/catppuccin/python/tree/main
使用pip安装该库:
pip install catppuccin
使用如下代码进行绘图:
1import catppuccin
2import matplotlib as mpl
3import matplotlib.pyplot as plt
4
5mpl.style.use(catppuccin.PALETTE.mocha.identifier)
6plt.plot([0,1,2,3], [1,2,3,4])
7plt.show()

Catppuccin包还可以混合不同的样式表,例如结合基本的seaborn-v0_8-dark和mocha。

mplcyberpunk
使用这个Python包,不仅可以提供适当的颜色和背景,还可以为图表添加发光效果,只需3行代码即可创建“赛博朋克”风格的图表。https://github.com/dhaitz/mplcyberpunk

matplotx
这是matplotlib的另一个扩展,可以像以前的扩展一样使用pip安装。它提供20个不同的主题风格。
pip install matplotx[all]
直接在python代码中引用:
1import matplotx
https://github.com/nschloe/matplotx

gruvbox
基于Pavel Pertsevs Gruvbox调色板和主题,为Python的Matplotlib绘图库设计了一种简单的深色背景颜色样式。
https://github.com/thriveth/gruvbox-mpl
这是一个样式文件gruvbox.mplstyle,下载后放到你的当前工作目录,在python代码中使用:
 import matplotlib.pyplot as plt
plt.style.use('./gruvbox.mplstyle')
