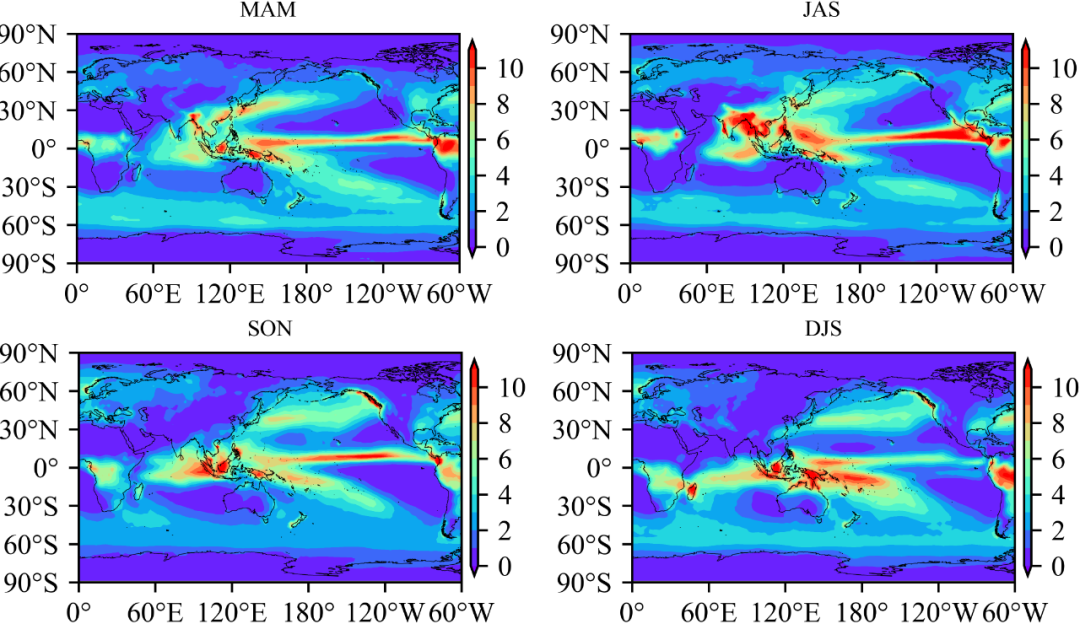
全球降水气候数据集(GPCP)由NASA戈达德太空飞行中心制作,数据结合了特殊传感器微波成像仪(SSM/I)项目和散射算法、GOES降水指数(GPI)、输出长波降水指数(OPI)、雨量计和NOAA极轨卫星上的TOVS探测仪的降水估计等数据,数据空间分辨率约为150km。
官网下载链接:http://gpcp.umd.edu
"""@Features: 空间分布图 季节平均@Date:2022/4/30"""import matplotlib.pyplot as pltimport numpy as npimport netCDF4 as ncimport cartopy.crs as ccrsfrom cartopy.util import add_cyclic_pointimport cartopy.feature as cfeaturefrom cartopy.mpl.ticker import LatitudeFormatter, LongitudeFormatterfrom matplotlib import rcParamsconfig = {"font.family":'Times New Roman',"font.size":10,"mathtext.fontset":'stix'}rcParams.update(config)def sea_mean(start): temp = [] for i in range(start, 468, 12): temp.append(i) temp.append(i + 1) temp.append(i + 2) mean_season = np.nanmean(pre[temp, :, :], 0) return mean_seasonif __name__ == '__main__': dataset = nc.Dataset('F:/RMatlab/data20211219/precip.mon.mean.nc') print(dataset.variables.keys()) lon = dataset.variables['lon'][:].data lat = dataset.variables['lat'][:].data time = dataset.variables['time'] real_time = nc.num2date(time, time.units).data pre = dataset.variables['precip'][:].data pre[pre < 0] = np.nan fig = plt.figure() for i in range(4): mon = [3, 6, 9, 12] title = ['MAM', 'JAS', 'SON', 'DJS'] proj=ccrs.PlateCarree() extent = [-180,180,-90,90] ax = fig.add_subplot(2, 2, i + 1,projection=ccrs.PlateCarree(central_longitude=180),facecolor='gray') ax.set_extent(extent, crs=ccrs.PlateCarree()) ax.coastlines() cycle_data, cycle_lon = add_cyclic_point(sea_mean(mon[i]), coord=lon) cycle_LON, cycle_LAT = np.meshgrid(cycle_lon, lat) cs = ax.contourf(cycle_LON-180, cycle_LAT, cycle_data,cmap='rainbow', extend='both',levels=range(0, 12)) ax.add_feature(cfeature.COASTLINE.with_scale('50m'),linewidth=0.2,zorder=2,color='k') plt.title(title[i],fontsize=8) cbar=plt.colorbar(cs,shrink=0.63,orientation='vertical'
,pad=0.02,aspect=30,extend='both') ax.set_xticks(np.arange(extent[0], extent[1] + 1, 60), crs = proj) ax.set_yticks(np.arange(extent[-2], extent[-1] + 1,30), crs = proj) ax.xaxis.set_major_formatter(LongitudeFormatter(zero_direction_label=False)) ax.yaxis.set_major_formatter(LatitudeFormatter())plt.savefig('F:/Rpython/lp37/plot142.png',dpi=800,bbox_inches='tight',pad_inches=0)plt.show()
声明:欢迎转载、转发本号原创内容,可留言区留言或者后台联系小编(微信:gavin7675)进行授权。气象学家公众号转载信息旨在传播交流,其内容由作者负责,不代表本号观点。文中部分图片来源于网络,如涉及作品内容、版权和其他问题,请后台联系小编处理。

欢迎加入气象学家交流群
请备注:姓名/昵称-单位/学校-研究方向


❤️ 「气象学家」 点赞


